Identifying Preferences in the Clientele of a Coffeehouse
Analyses of sales data from a local business to identify patterns in items sold

Project details
Project Requirements
- Assess the state and structure of the data.
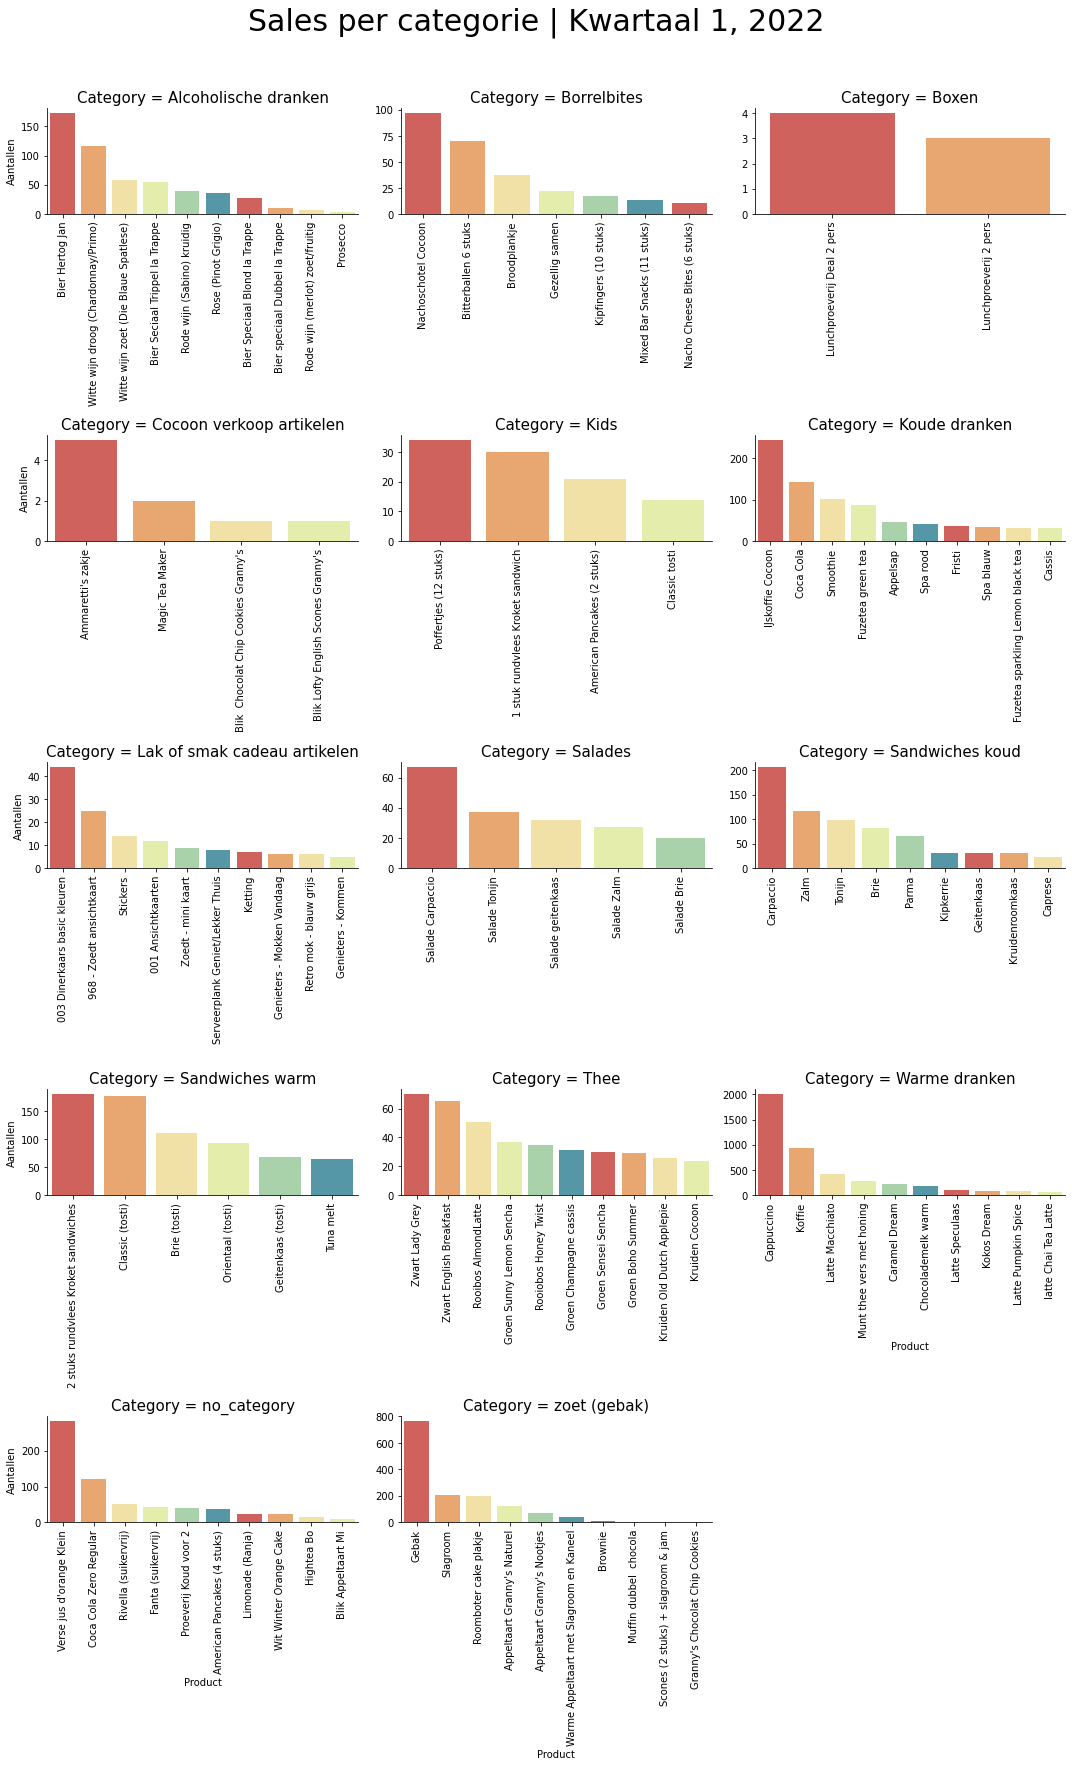
- Visualize sales per quarter, year and category.
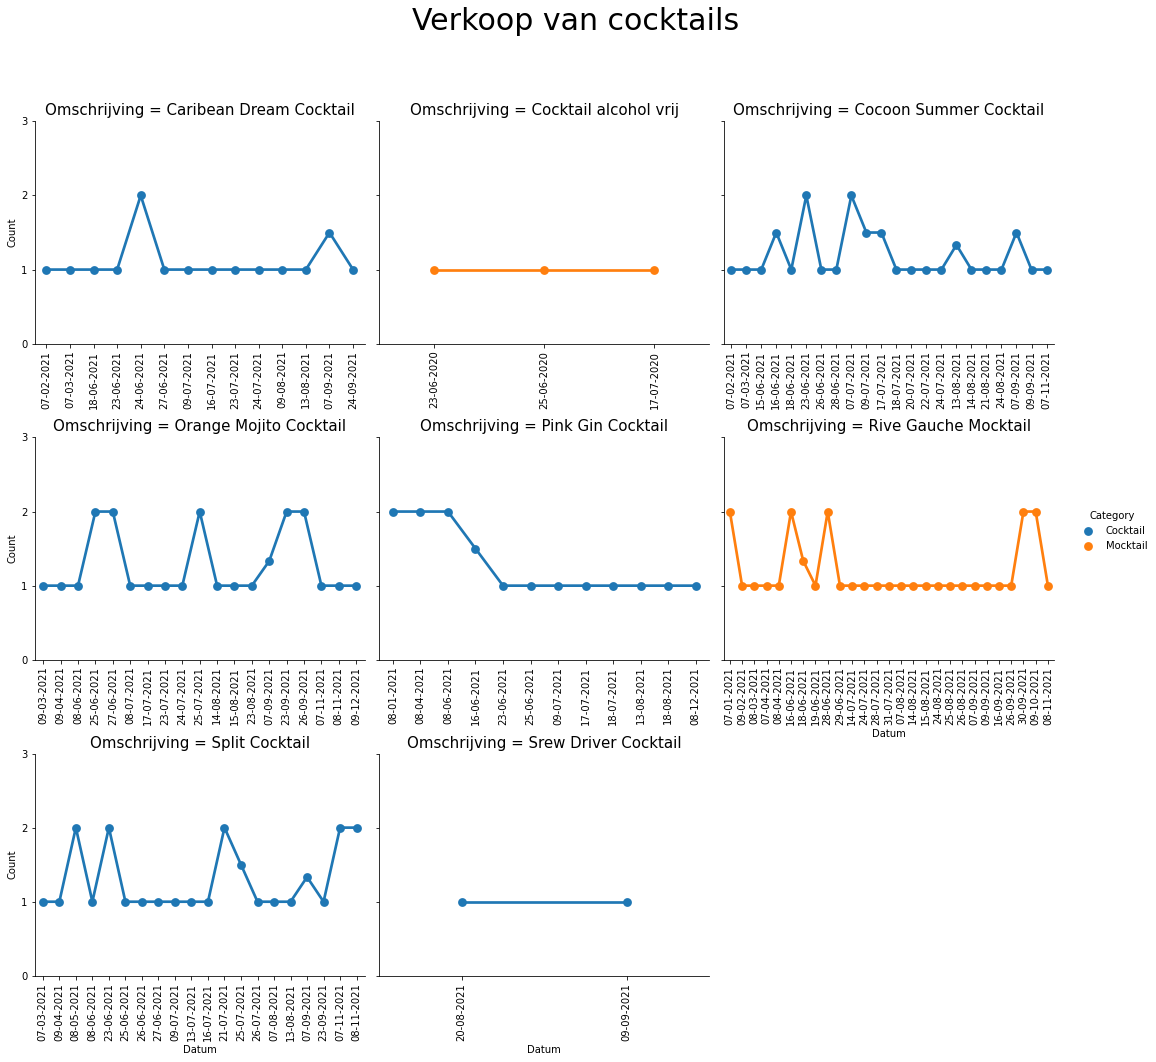
- Visualize cocktail sales in the summer of 2021.
- Perform a Market Basket Analysis.
- Present the results in a understandable and usable manner to the client.
Project Overview
The owner of Cocoon Coffee & More asked me to analyze his sales data since the company started in 2019. The current cash register system provides only rudimentary insights into sales, which is not always sufficient. Certain questions remained unanswered, and an analysis using Python could address these gaps. This project also aimed to gain familiarity with data practices for a smaller company. My task was to explain the advantages of this approach and, above all, answer the outstanding questions.
- What are the bestselling products per category, per quarter and per year?
- How well did the different cocktails sell in 2021?
- Which products are often bought together?
The Challenges
Some data wrangling was required before analyses could be performed. The raw notation of purchased products on the receipts was not suitable for counting and analysis straight away. These entries had to be adjusted so Python could correctly interpret the different items and quantities. Additionally, not all products had a clear category. Approximately 15.7% of products had no category assigned, which made subsequent analyses slightly less accurate. This was addressed by labeling these products as having no assigned group. Improving product annotation was one of the recommendations given to the client.
A final challenge was presenting the results in a way that was easy for the client to understand. Results and technical terms needed to be explained clearly without leaving out important information. I documented the outcomes of the analyses in a report and presented this to the client. The results were accompanied by explanations of the key metrics so he could gain actionable insights into his business.
The Approach & Solution
The analyses were performed using Python, with each research question handled by a separate script. At this stage, the project serves as an introduction to data analysis. More permanent solutions can be discussed later. Reading, cleaning, and visualizing the data were all done using Python and its associated packages. Data visualization was handled using the Seaborn library1, which is an add-on for Python. For the quarterly sales visualizations, I chose a faceted grid2 with bar charts to display multiple categories at once while maintaining readability. I used a similar approach for the cocktail sales, but applied it to a time series instead.
The Market Basket Analysis was performed using the MLxtend library3, which implements the apriori algorithm4 in Python. This analysis processes all receipts and returns association rules that show which items are frequently bought together. It also provides an estimate of how likely products are to be purchased within the same transaction. Observations like these can help identify key products or inform product placement decisions. The most prominent association rules are shown below.
| Association Rule | Support | Confidence | Lift |
|---|---|---|---|
| Cappuccino ⇒ Pastry | 0.088 | 0.240 | 1.271 |
| Pastry ⇒ Cappuccino | 0.088 | 0.467 | 1.271 |
| Coffee ⇒ Pastry | 0.056 | 0.238 | 1.259 |
| Pastry ⇒ Coffee | 0.056 | 0.296 | 1.259 |
| Coffee ⇒ Cappuccino | 0.087 | 0.372 | 1.014 |
| Cappuccino ⇒ Coffee | 0.087 | 0.238 | 1.014 |
The Results
Once the analyses were completed, the results were presented to the client in a printed report and an on-site presentation. Large versions of the graphs were also delivered as separate files. Knowing which products sell well helps the client make better business decisions. This provides insight into bestsellers and the performance of seasonal items such as cocktails. The Market Basket Analysis shows that sales of pastries, cappuccino, and coffee are related. Lift values greater than 1 indicate a relationship between the products on either side of the arrow. The Support value represents the percentage of transactions that include a specific combination. For each combination, the Confidence score differs between mirrored rules. This value represents the proportion of transactions containing product X that also contain product Y, and can be used as an estimator. In this case, customers often buy cappuccino or coffee together with a pastry. When looking at the Confidence values, someone purchasing a pastry is more likely to also buy cappuccino or coffee than the other way around.
These rules are valuable because they describe patterns in how customers actually behave when making purchases. This kind of insight can be applied directly in practice:
- Product placement: By placing pastries close to the coffee machine or promoting them together, the café can encourage bundled purchases.
- Menu design: Highlighting combinations in the menu (e.g., “Coffee & Pastry Special”) can capitalize on natural buying behavior.
- Inventory planning: Knowing which items are often sold together helps with stock management and reduces the risk of running out of popular combinations.
- Upselling opportunities: Staff can be trained to recommend coffee when a pastry is ordered, or vice versa, making sales strategies data-driven rather than guesswork.