Would I Have Survived the Titanic?
Using k-Nearest Neighbors to determine if I would have survived the Titanic and to make a webapp for others to use.
Project details
Project Requirements
- Clean and prepare the data.
- Perform exploratory data analysis.
- Train a k-nn model and enter my own data.
- Create a webapp to let others use the model
Project Overview
In 1912, the RMS Titanic sank to the bottom of the North Atlantic Ocean. It is perhaps the most famous shipwreck, especially since it is one of the deadliest tragedies involving a cruise ship to this day. The event inspired many artistic works in the years that followed. Almost everyone knows James Cameron’s movie starring Kate Winslet and Leonardo DiCaprio, for example.
People have long been interested in documenting the sinking of the Titanic. As a result, data about the passengers is available to the public for anyone to analyze. We know, among other things, their age during the voyage, passenger class, and the number of family members on board. Most importantly, we also know whether someone survived or perished that day. When I stumbled upon this dataset, I wondered if I would have survived the shipwreck. Using machine learning, I wanted to create a model that classifies people into two groups: “survivor” or “victim”, based on known characteristics. By entering my own data, I could get an estimate of which group I would belong to.
Data and Preprocessing
The dataset comes from Kaggle1 and includes the following attributes:
- Passenger ID
- Survived or perished
- Passenger class
- Name
- Sex
- Age
- Number of spouses or sibling onboard
- Number of parents or children aboard
- Ticket number
- Fare paid
- Cabin number
- Port of Embarkation (Cherbourg, Queenstown or Southampton)
First, I took a closer look at the data itself. To create a trustworthy model, the dataset should not contain missing values. I plotted the data to visualize the ratio of missing values, shown as yellow bars, for each column.
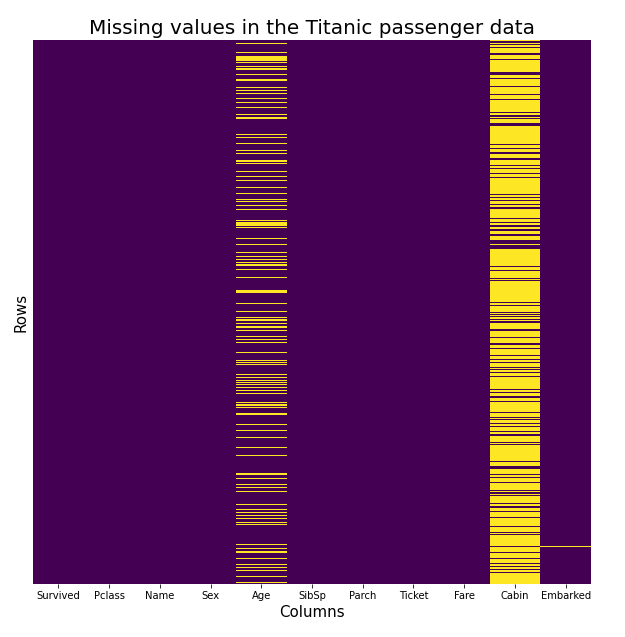
This visualization shows that three columns contain missing data. A number of passengers have an unknown age. I could delete this column, but age seemed like important information for the model. Instead, I replaced the missing values with the average age per passenger class. The “Cabin” column contained too many missing values to replace reliably, so I removed it from the dataset entirely. There was also a single missing value in the “Embarked” column, so I dropped just that row. After these steps, no missing attributes remained.
Exploratory Data Analysis
After cleaning the data, I explored the dataset further. Using visualizations made with Matplotlib2 and Seaborn3 for Python, survival rates for different groups became more apparent. The first plot shows the number of people who perished and survived, divided by gender.
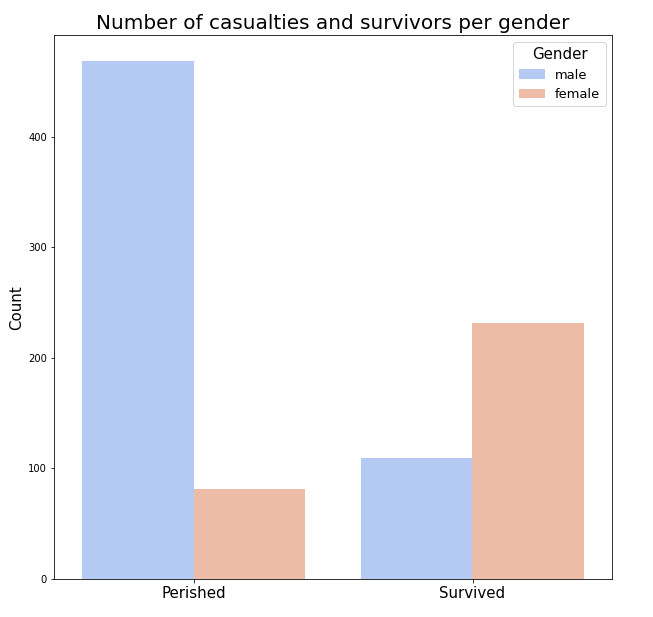
As a man, my chances of surviving the Titanic dropped significantly. Most men died in the disaster, as shown by this graph. Next, I plotted the number of victims for each age group in years. (click on the plot to view a larger image)
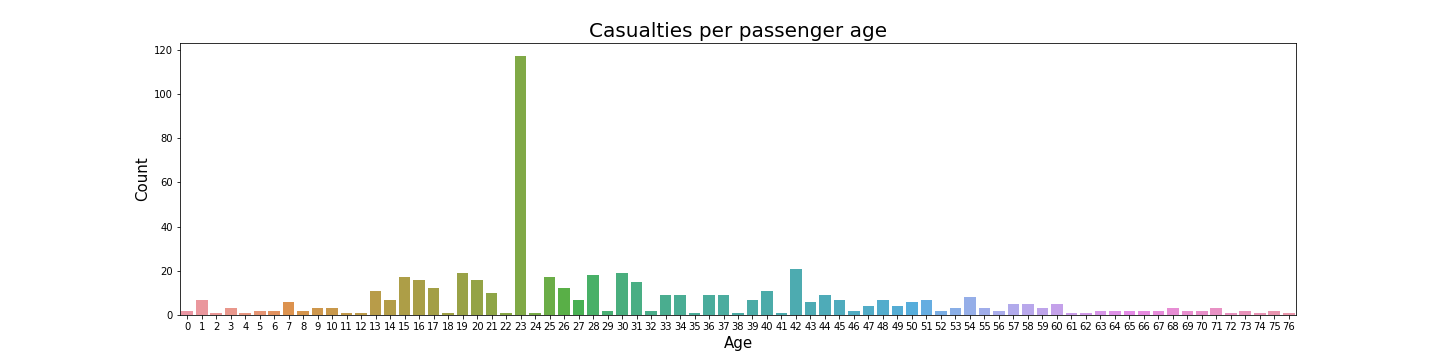
I'm in my thirties, and my chances of safely reaching shore keep getting slimmer. Looking at this plot, I am clearly in the age group where, statistically, most people did not make it home.
The k-Nearest Neighbor Algorithm
There are multiple algorithms that can be used for classification tasks. For this project, I used k-nearest neighbors to build a model. For new data, the algorithm looks at nearby data points. If most of its neighbors belong to a particular group, the new data point will most likely be classified into that same group. The k-value represents the number of neighbors taken into account.
Choosing a suitable k-value is important for achieving good performance. Each value has a certain error rate, and the k with the lowest error is preferred. One way to determine this is by training multiple models with different k-values and plotting the results. Below is a plot showing error rates for k-values ranging from 1 to 70.
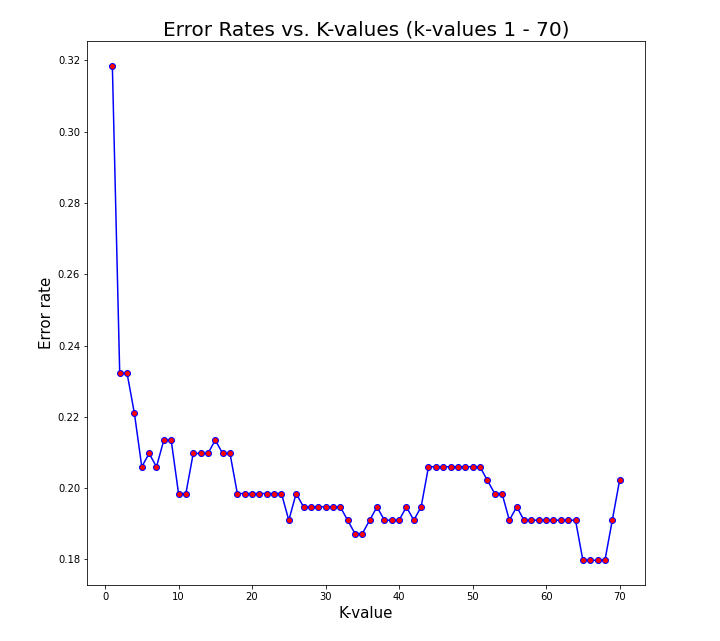
This figure shows that the lowest error rate occurs at a k-value of 63. I used this value for the final model that predicts whether I would live or die. I normalized the data and split the dataset into two parts: one for training and one for testing. After training the model, the following metrics were available to evaluate its performance.
| Precision | Recall | F1 Score | |
|---|---|---|---|
| Died | 0.81 | 0.90 | 0.86 |
| Survived | 0.81 | 0.65 | 0.72 |
It’s tempting to judge a model by its overall accuracy, but in this case that would be misleading. The dataset is unbalanced as far more people perished than survived. So a model that simply predicted “died” for everyone would still achieve high accuracy without being useful. That’s why precision and recall are more appropriate metrics to evaluate here.
The high precision tells me that when the model predicts a passenger either died or survived, it is correct 81% of the time. This means the model’s positive predictions are reliable in most cases. Recall, on the other hand, measures how many actual positive cases the model captures out of all those present in the dataset. In other words, it shows how well the model identifies everyone who truly belonged to a class. Here the recall is much stronger for passengers who died than for those who survived, which indicates the model is better at recognizing victims than survivors. The F1-score represents the harmonic mean of precision and recall. This metric balances the tradeoff between the two, which is especially important when working with imbalanced datasets like this one. The F1 scores confirm that the model performs reliably, but with a clear bias toward the majority class.
Would I have Survived?
With all the necessary components in place, it was time to make a prediction about myself. I created a new entry and set my age to 30 and my gender to male. Queenstown is the closest port, so I used that as the port of embarkation. Next, I calculated the average fare price per class and adjusted it for inflation. A first-class ticket would cost €12.318 today, second class €3.079, and third class €2.053. These prices were calculated by adjusting British pound values for inflation4, using an average of 4.5% per year, and then converting them to euros. At the moment, I could only afford a third-class ticket, so I added that class and fare price, which was £14 at the time, to my data. Finally, I added zero parents or children and zero spouses or siblings. Although I would take my girlfriend on holiday, only married couples are counted in this dataset.
I fed this data into the model and anxiously waited for the final verdict.
drum roll..
I would most likely have died on April 15, 1912. While not entirely unexpected after exploring the data, it is still a grim prediction. According to the model, there is an 81% chance that this classification is correct.
Curious about your own chances of survival? I built a webapp that lets you use the model yourself.