Detecting birds with the Raspberry Pi
Creating a pipeline to detect birds on my balcony
Project details
Project Requirements
- Set up a system that takes pictures to gather data.
- Create a model that separates pictures of birds from accidental images of other objects (false positives).
- Save images to a database and add valuable attributes.
- Visualize the data to discern patterns.
Project Overview
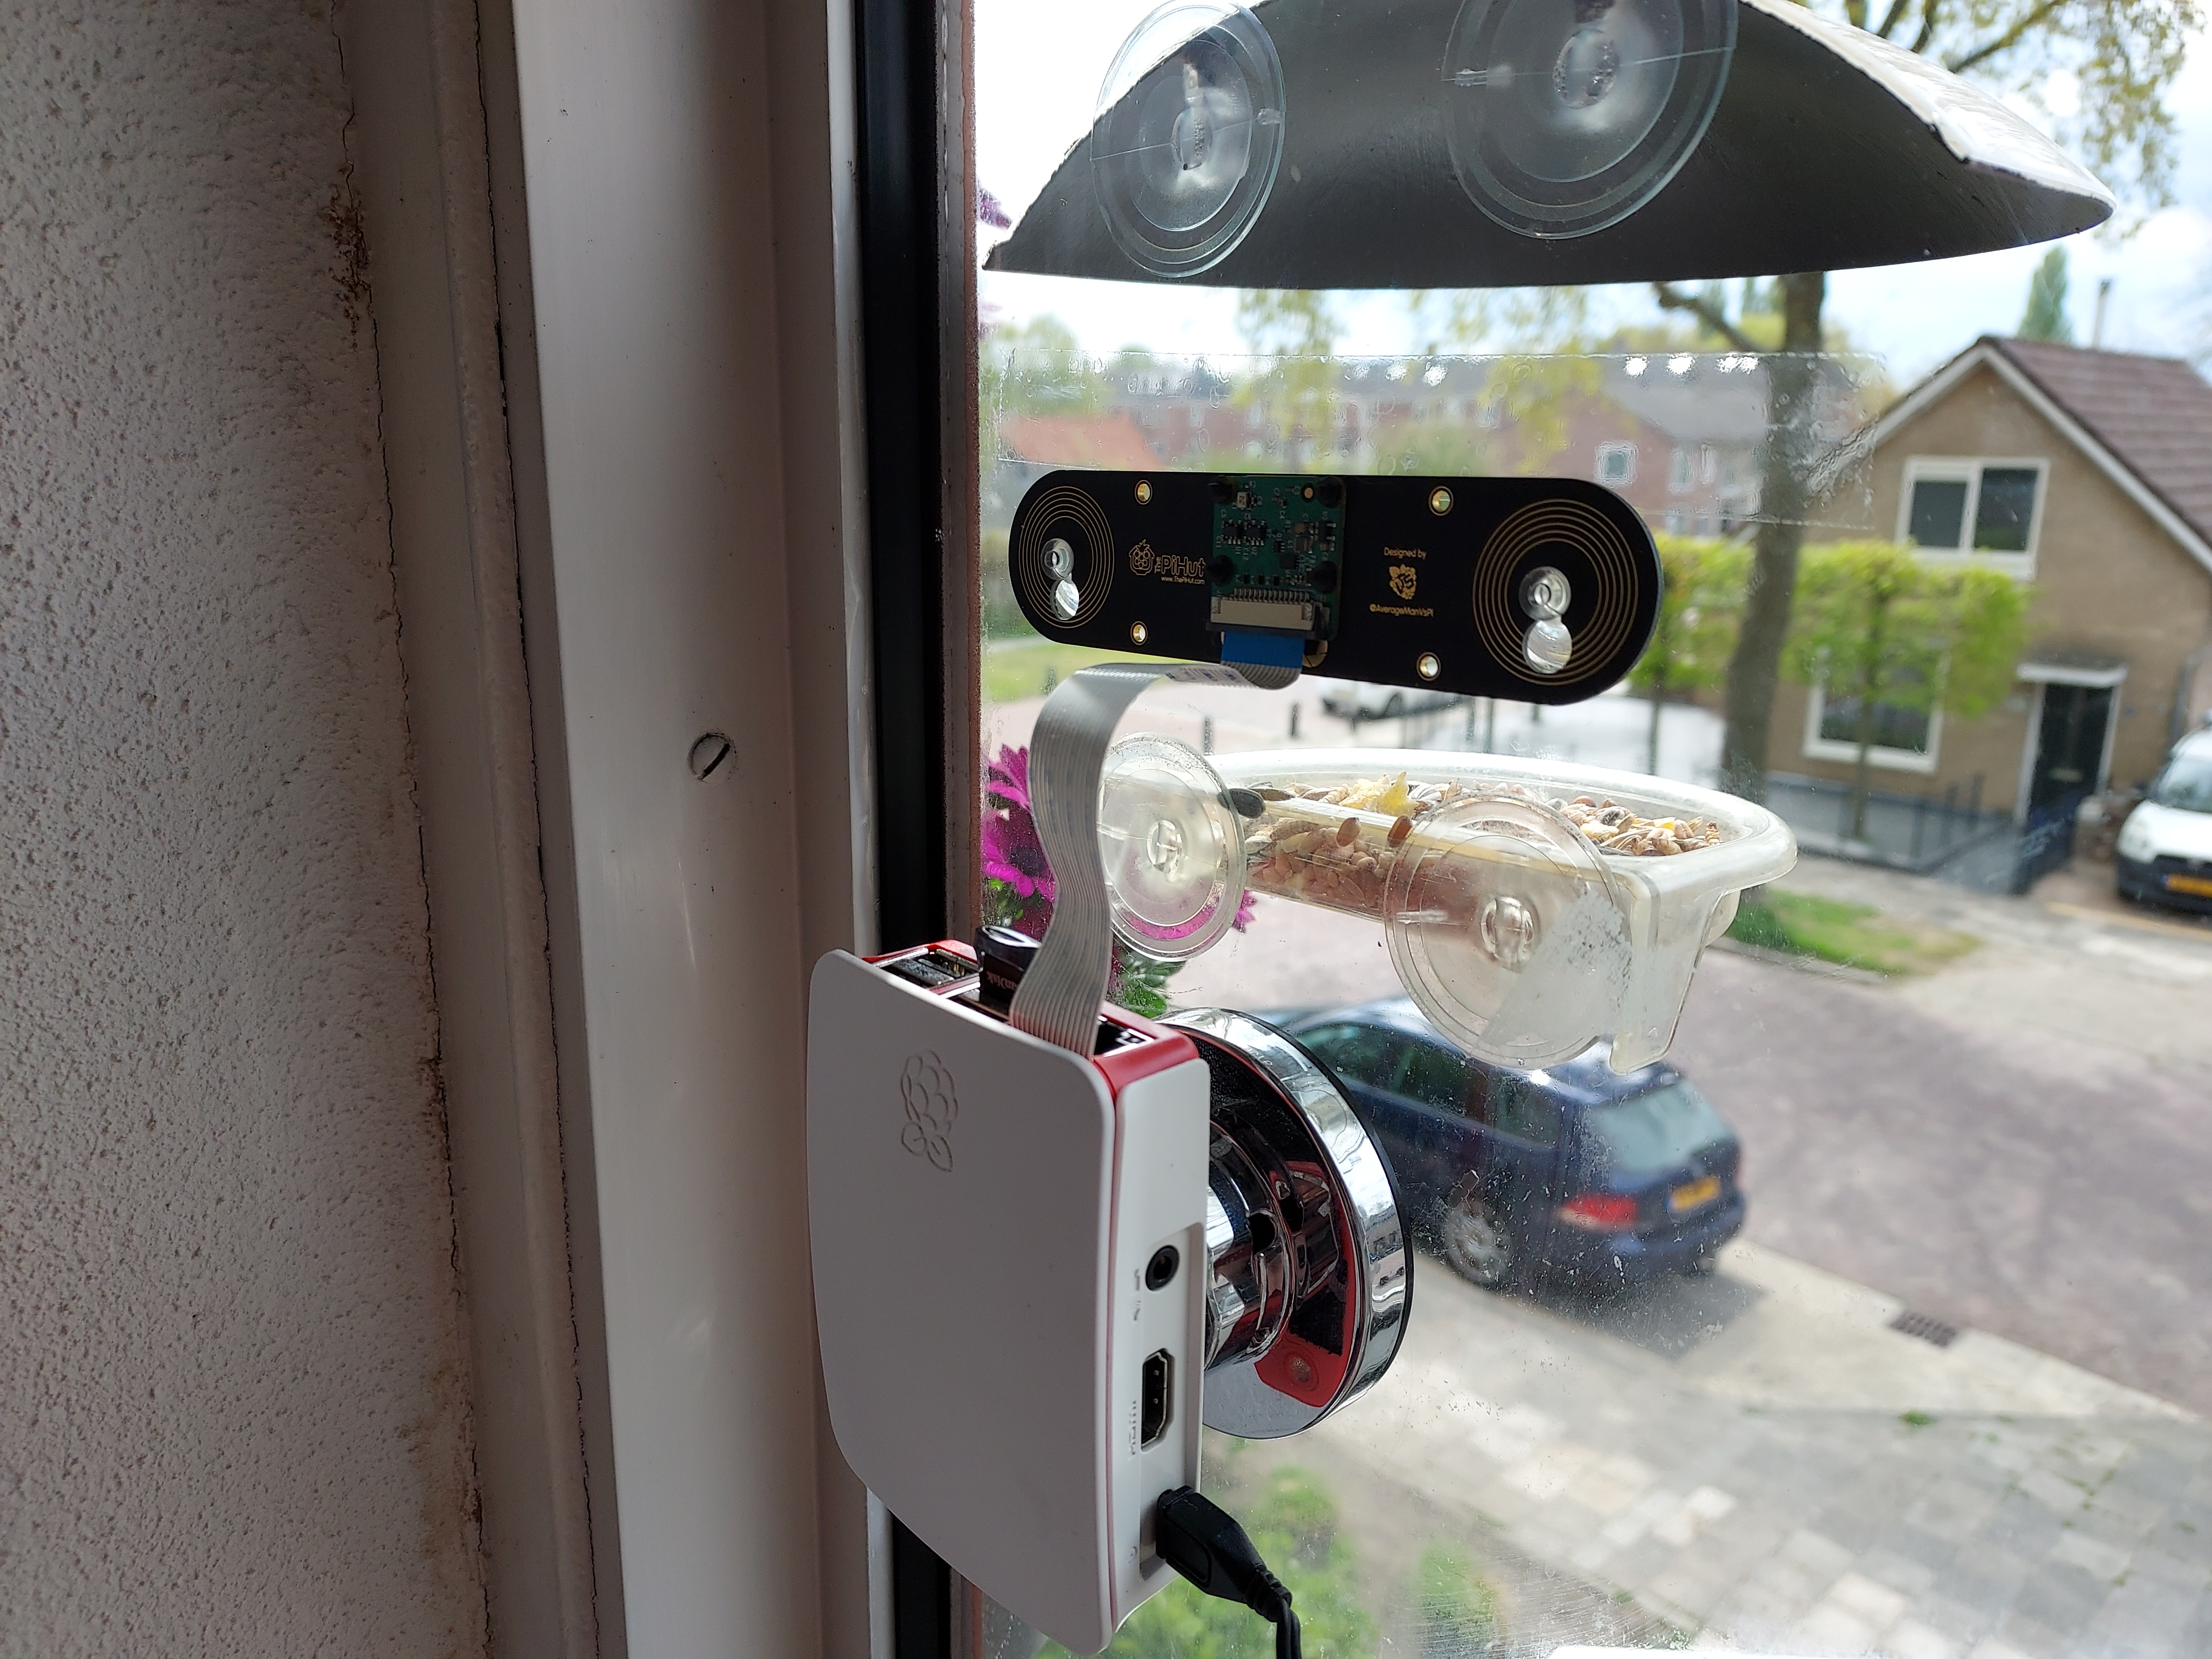
One of my favorite things to do in my free time is birdwatching. Unfortunately, I cannot spend as much time outside as I would like. Having a balcony instead of a garden does not help either. That is why I installed a feeder on the outside of my window and placed a Raspberry Pi with a camera on the inside. I now get daily pictures of birds that come to visit me.
However, I want to do more than just save and look at photos. In this project, I built a pipeline that decides whether a bird is captured on camera using a convolutional neural network and stores the data in an organized database. Hopefully, this provides some insight into the daily lives of urban birds.
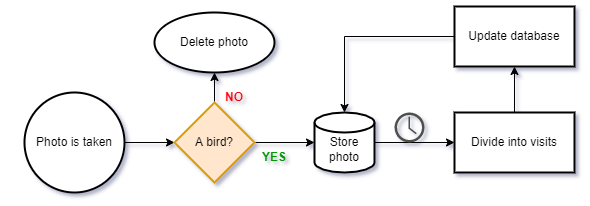
I needed data to train a model that recognizes birds instead of cars, for example. Otherwise, I would still have to sift through images manually. The Raspberry Pi uses a model created with Microsoft’s Lobe1 to filter out photos without birds. The results are stored neatly afterwards. As a final step, the pictures are subdivided into visits. The process looks like this:
The Data
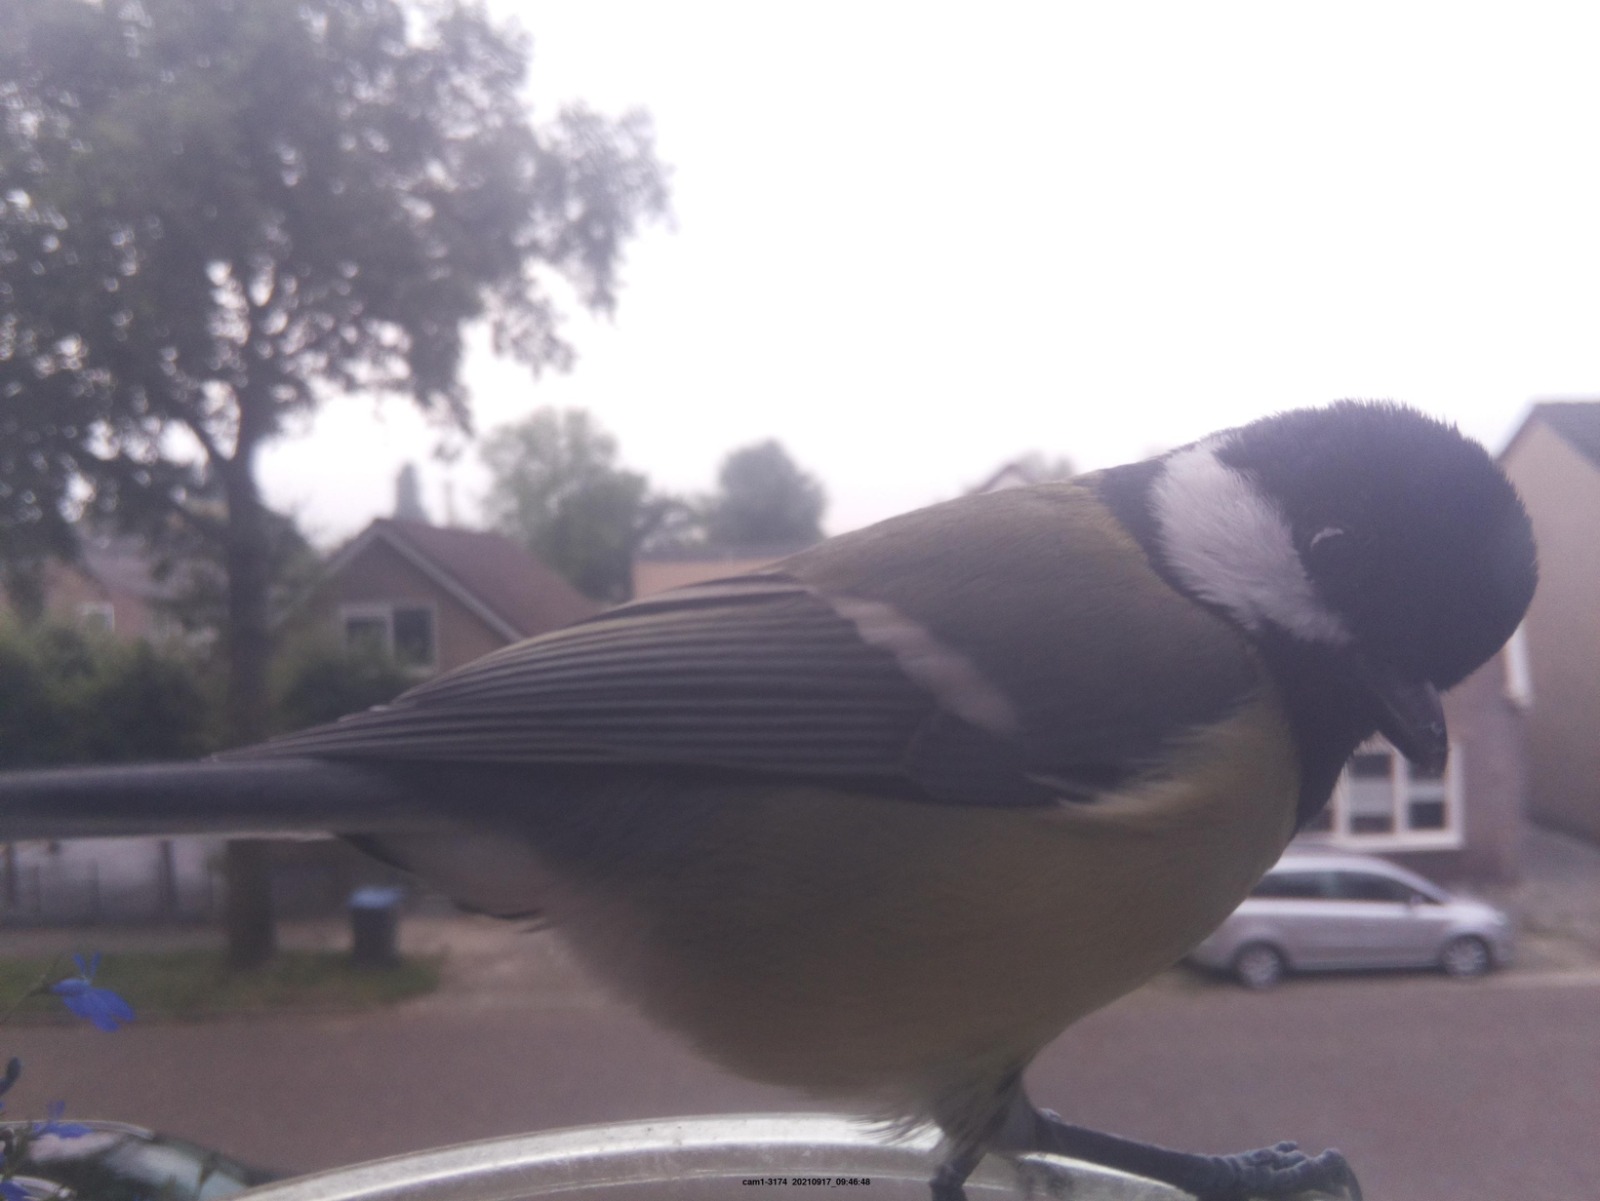
Over the course of a year, I took pictures of birds that came to the feeder. I used the PI-TIMOLO2 library on a Raspberry Pi 3B in combination with the camera module. Every time movement is detected, a picture is taken and stored. After a year of collecting images, the dataset consists of 994 pictures of birds and 994 pictures of non-birds. Even though the script can be configured to only take photos of fast moving and large objects, false positives can’t be entirely prevented. Cars and other vehicles are often captured as well. The first model is only trained to recognize whether a bird is present. This makes the subsequent second model, which will determine the species, more accurate. In the next steps, I use Lobe, Python, and MySQL to load and prepare the data, train and deploy the model, and save the pictures.
In comparison to large datasets, 1,988 pictures is not that much to train the first model with. Lobe increases the dataset size using a technique called image data augmentation. Every picture is slightly modified to expand the amount of data available. For each image, Lobe creates five random variations.
Step 1 - Separating birds from the rest
Now that I have more data, it’s time to build the first model. This is the brain of the operation that decides whether something is a bird or not. The photos, separated into directories for each class, are loaded into Lobe. The software starts training directly after importing the data. While it’s great that the software does most of the work, a lot of autonomy is lost. The inner workings are predefined and not customizable. The only parameter I can influence is whether the model focuses on accuracy or speed. Since speed is more compatible with the Raspberry Pi, I chose that option.
The result is a model with an accuracy of 97%, which is excellent. Lobe provides a clear overview of the achieved accuracy and shows which images are correctly or incorrectly classified in the training data. I exported the model in the TensorFlow Lite3 format, which is optimized for lightweight devices like the Pi. Lobe also provides a Python module4 to use the model and classify new images. When an image is taken, it is passed to a Python script that uses the model to make a prediction. The prediction with the highest confidence is returned along with its accuracy. Based on this information, I can decide how to handle each photo in the next phase.
Step 2 – Storing the images
When the Raspberry Pi captures images of identified birds, each photo is stored in a MySQL database. For every file, the name, date and time, and prediction accuracy are stored. I chose to store file names rather than the images themselves, and let other parts of the software handle the logic when retrieving the raw data.
Photos are taken in succession if a bird keeps moving around, so multiple images can belong to the same visit. Every night, a Python script runs to divide images into separate visits. These visits have a time of arrival, time of departure, and a duration in seconds. Photos that belong together receive the same ID to keep visits separate. A visit consists of images taken within 20 seconds of each other. The database structure looks like this:
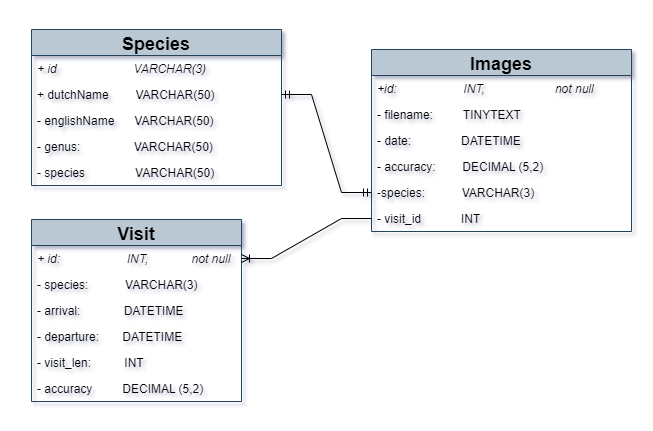
The Species table and related columns are currently not in use. I plan to build a second model that recognizes bird species in the future. This is outside the scope of the current project, but I already accounted for it in the database design. Photos without birds are not particularly interesting, but not entirely useless either. They are not saved in the database, but moved to a different folder instead of being deleted. This data can be used later to retrain or improve the model with more examples. When training prediction models, volume is an important factor.
Step 3 – Visualizing the data
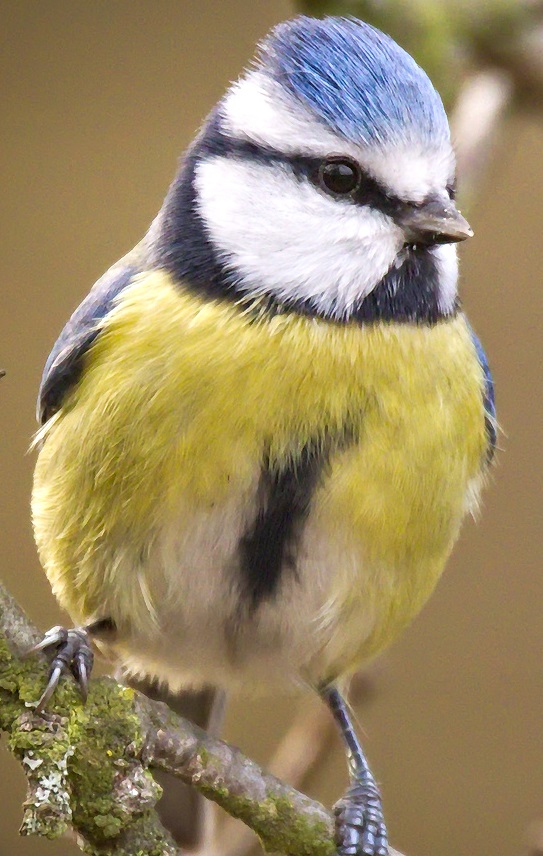
The final step is analyzing and visualizing the data. A graphical representation makes it easier to spot patterns. At this point, species diversity is still limited. Only Eurasian Blue Tits, Great Tits, and a single European Robin have visited the feeder so far. The data currently only represents these species. Let’s look at some basic facts about the visits up to this point:
| Mean | 11,90 seconds |
|---|---|
| Max | 128 seconds |
| Min | 4 seconds |
The average visit lasts only a few seconds. Birds are cautious by nature and don’t take much time to enjoy a meal before moving on. Since the camera can only take one photo every four seconds, I adjusted the visit duration logic accordingly. Capturing higher resolution images takes slightly longer. This is a conscious tradeoff between a slightly less precise measurement of visit length and having better quality photos to keep training models with.
I started by visualizing the data as a time series. A line chart shows the increase and decrease in the total number of visits per day, grouped by month. (click on a graph to enlarge)
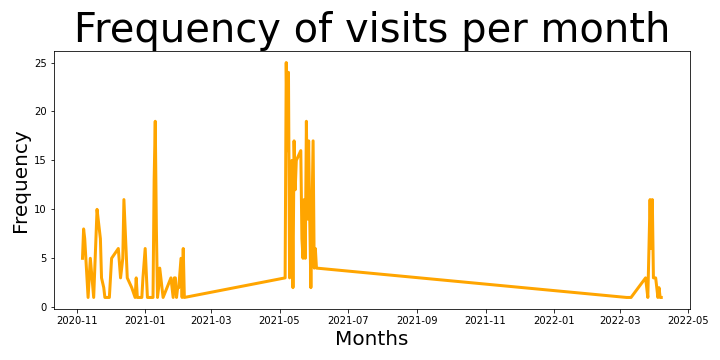
This chart shows that the data is irregular and that some months have no entries at all. This is caused by maintenance downtime on the Raspberry Pi, experimenting with settings early in the project, and occasionally forgetting to refill the feeder. I concluded that more complete data coverage is needed. In the meantime, I use averages for the data that is available.
Next, I created bar charts showing the average number of visits per month and per hour of the day using Matplotlib5. This provides more insight into bird foraging behavior.
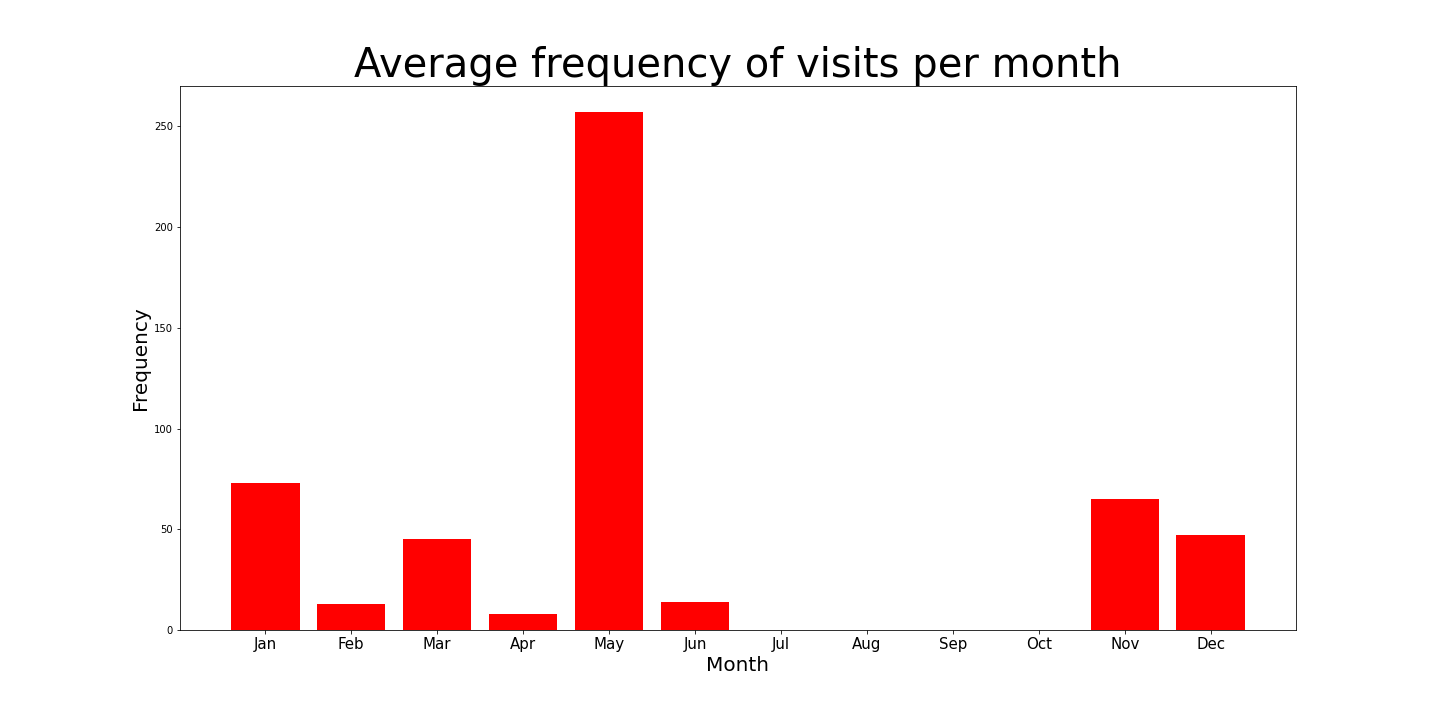
The chart on the left shows average visits per month. As expected, birds look for extra food during the winter months. Natural food sources become more scarce during this period, so additional feeding helps. A less expected result is the increase in visits during May. This likely happens because there are more mouths to feed, as most young birds hatch during this time. The sudden rise is still surprising. Gathering more data will show whether this is actually a gradual increase or a sharp spike.
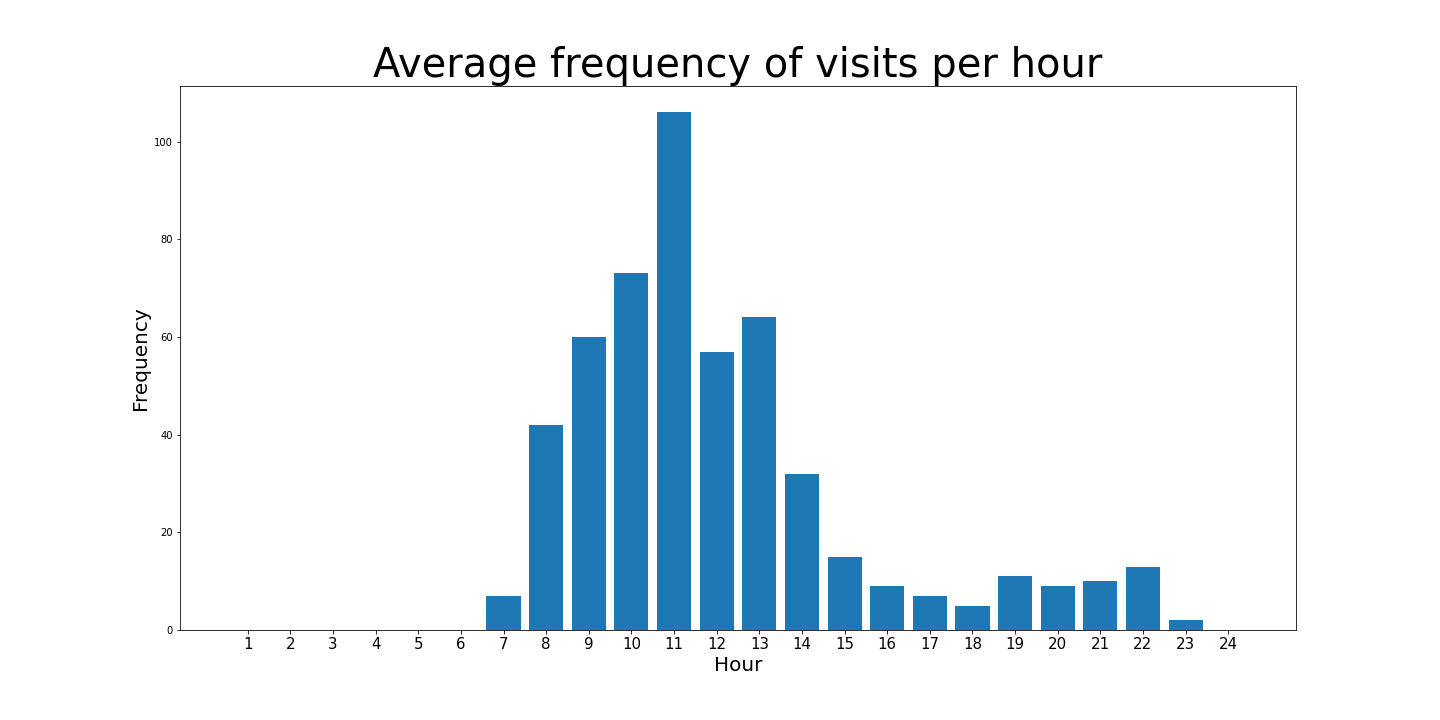
The bar chart on the right shows the average visit frequency for each hour of the day. This reveals two distinct active periods. The first starts in the morning and peaks just before midday. After a quieter afternoon, birds return for a late evening meal before settling down for the night. This is a broad conclusion based on averages across nearly two years. Visiting hours may differ per month, which can be visualized using a heatmap. Darker colors indicate more frequent visits.
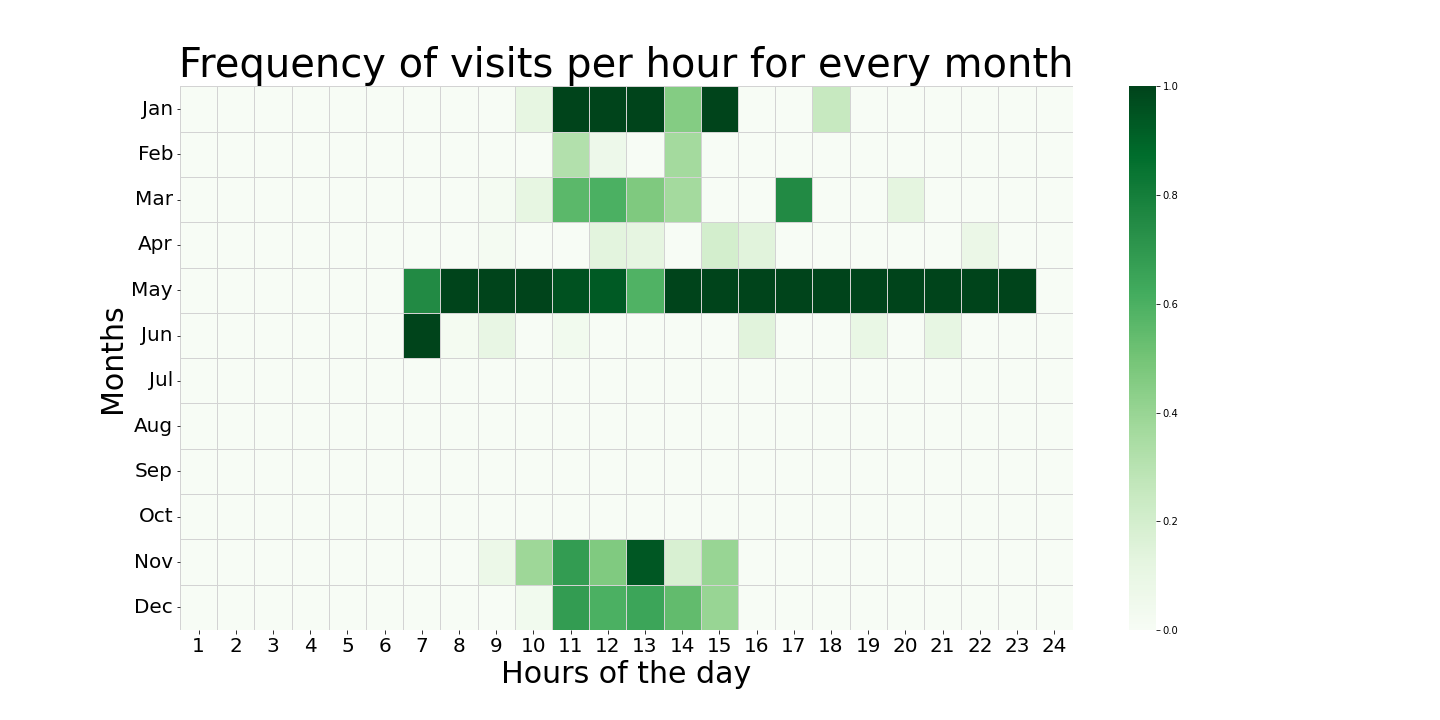
This heatmap confirms that birds visit at different times depending on the month. My assumption is that birds forage during daylight and avoid nighttime activity to sleep6. The visualization clearly reflects shorter winter days and longer summer days in terms of daylight availability.
What's next?
These findings conclude the project for now. The Raspberry Pi can automatically collect new data and add it to the database. A next step would be creating more dynamic graphs that update as new images are added. Daily reports would also be useful. As the dataset grows, the insights will become more detailed.
Another future step is adding a second model to recognize bird species. This would add significant value, as different species may have different foraging patterns. This will be challenging, as a large amount of training data is required. Unfortunately, I can’t control which bird species decide to visit my feeder. When I get around to this, it will be added to my portfolio as a separate project.